If you’ve been investing in the Thrift Savings Plan for more than just a few years, I’m sure that you remember what happened to the TSP stock funds during 2008 and early 2009. The C Fund, which tracks large cap U.S. stocks, lost over 55 percent of its peak value. The S Fund (invested in small cap stocks) and I Fund (which tracks international equities) suffered even larger drawdowns. It was enough to scare many investors out of the market.

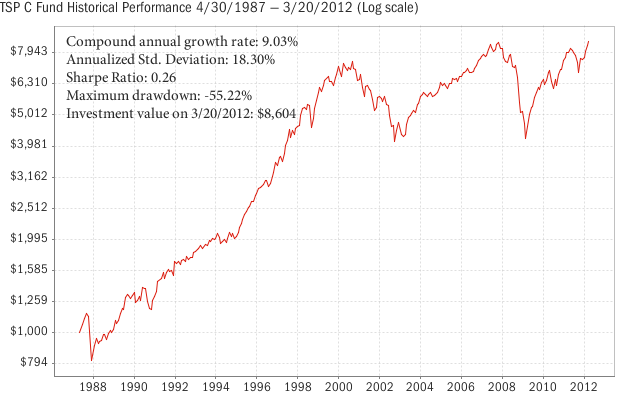
So it may come as a surprise that only 3 years later, the C Fund has just about recovered from its losses. It closed at $17.50 yesterday, just seven pennies shy of its former high price reached during the peak of the previous bull market in October 2007. That’s a gain of over 123 percent in three years, which works out to an annualized compound gain of over 30 percent. To put this in perspective, the historical average return for U.S. large cap stocks (as measured by the S&P 500 index) is “only” about 10 percent per year. At this rate, it would take more than eight years to compound gains of 123 percent. The following chart of the TSP C Fund shows how relatively quickly the stock market has roared back, compared to previous bear markets:

(TSP C Fund as of 20 March 2012. Latest chart here).
As for the small cap S Fund, it has already surpassed its previous 2007 peak, gaining about 135% since March 2009. It blasted right past its former high price of $21.29 and and is now at $23.65, already 11 percent above its previous high. Small cap stocks are known to out-perform during certain market cycles, and the past three years have been a great example of this.
The only TSP equity fund that has not fully recovered yet is the I Fund, which is still 24 percent below its 2007 peak. So much for the theory—proposed by many over the past several years—that international stocks would out-perform the more mature stocks in the U.S. market. Still, the I Fund has gained 93% since the March 2009 lows, an impressive performance by any standard.
But the S&P 500 Index is still way below its 2007 high price?!?
That’s true for the “cash only” S&P 500 index, which is still hovering around 1,400, about 156 points below its 2007 peak value. The cash index is more widely followed than the S&P 500 Total Return Index, which has actually fully recovered its 2007 value. The difference? Stock dividends. It’s a good thing that actual investors in S&P 500 index funds such as the TSP C Fund benefit from regular stock dividend payments, and this makes all the difference.
What about bonds?
When stock markets roar, it can be insightful to look at the relative returns of less volatile asset classes such as bonds. Since March 2009, the TSP F Fund, which invests in high grade government and corporate bonds, has gained 34 percent. Not bad at all, but not nearly as much as the 123% gain in the C Fund. As for the risk-free G Fund, it is up 14% since then, a good reminder that risk and return often go hand in hand. This is by no means a suggestion to go dump your TSP bond funds! Portfolio diversification is always a good thing, and much appreciated during stock market corrections. The best portfolio is the one that you can commit to during both good and bad markets, and this is a personal decision that we all have to make for ourselves based on risk tolerance, time to retirement, etc.
Where do we go from here?
When J.P. Morgan was asked the question “what will the stock market do?”, he smugly replied “it will fluctuate.” That’s one thing that you can count on: markets will fluctuate. Stocks and bonds move in trends. Investors vacillate between bearish and bullish extremes. We’ve certainly seen high volatility—including as recently as last August—surrounding the European debt crisis.
What can we expect from stock markets here on out? No one really knows. It would not be unusual to see a market correction at these prices. Mean reversion is a powerful force in investing, and asset classes that have enjoyed unusually high recent gains are more likely to under-perform in the near future. But every now and then, bull markets can also keep running for longer than most participants think is fundamentally justified or even rational. Anyone remember “irrational exuberance” and high-flying technology stocks during the Internet dot-com craze in the late 1990s?
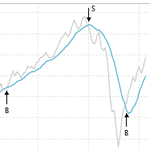
What is an investor to do? If you use a Relative Strength and Trend Following strategy such as ours, the answer is: just stay in the market until the trend has actually changed. The strategy will tell you when it is time to get out of risky assets again. Until then, hang on for the ride!


