About the TSP Folio Investment Strategy
In his perennial business best seller The 7 Habits of Highly Effective People, author Stephen Covey reports that effective people focus their efforts on things that they can do something about, and don't dwell on those that they have little or no control over. The same principle can be applied to successful investing: focus on factors that can be systematically measured and controlled, and ignore the noise.
A successful investor starts by choosing tax efficient investment solutions and investing in funds with a low expense ratio. As a TSP investor, you are fortunate to get these two by default, without any effort on your part. TSP accounts are tax-deferred, allowing your contributions and/or gains to compound tax-free for decades until you retire and start to withdraw them. And the TSP funds have expense ratios that are among the lowest you will find anywhere in the world. This is unlike the experience of the typical non-TSP investor: Wall Street is riddled with high expense ratio funds, and many investment advisors charge exorbitant annual fees that take a huge bite out of a retiree’s account.
Some TSP investors stop there. They simply invest their retirement contributions into a fixed allocation of stocks and bonds. The “lowest friction” option — TSP Lifecycle Funds — automatically takes care of regular account rebalancing to keep the percentages in the age-appropriate range. They just “set it and forget it.”
But at TSP Folio we take things several steps further. We recognize that there are several other important investment factors that can be measured and controlled, resulting in better risk-adjusted returns.
Momentum
Central to our investment approach is the fact that financial markets exhibit specific return factors — including momentum, small cap, and value — that can be measured and harvested.
Many investors are familiar with small cap or value investing: the basic idea is that you “tilt” your portfolio towards these factors, investing a portion in small cap and/or value stocks, because historically they tend to outperform other types of stocks.
The momentum factor is not as widely followed, even though academics and market professionals have known for decades that it is more pervasive and significant than small cap and value.[1] Momentum is the tendency of recent price changes in an investment or asset class to persist for some time into the future. The evidence for momentum is conclusive, supported by academic and practitioner research and more than 300 published papers over the past decades.
Capturing Momentum
Momentum can be measured and harvested in as many different ways as there are colors in the rainbow. The basic idea is that by investing in momentum stocks, or investing in an asset class while it is exhibiting relatively strong price momentum, you can capture some excess returns.
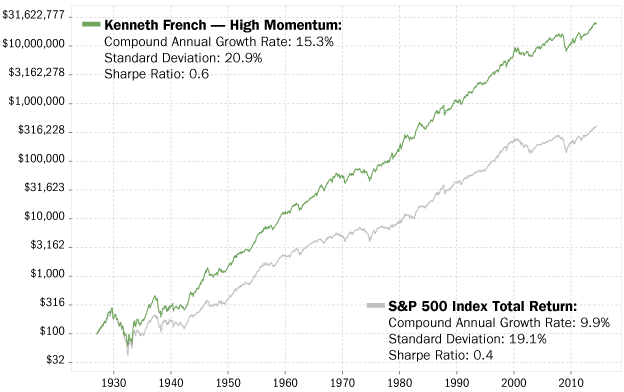
One popular approach — ahem, popular if you’re a finance geek — is published by finance Professor Kenneth French at Dartmouth University.[2] Below is a chart that we created with data from Dr. French’s research, showing the performance of U.S. momentum stocks for the past 87 years. As you can see, the momentum portfolio outperforms the S&P 500 index by over 5% per year. (Yes, the S&P 500 is the same index that is tracked by the TSP C Fund).
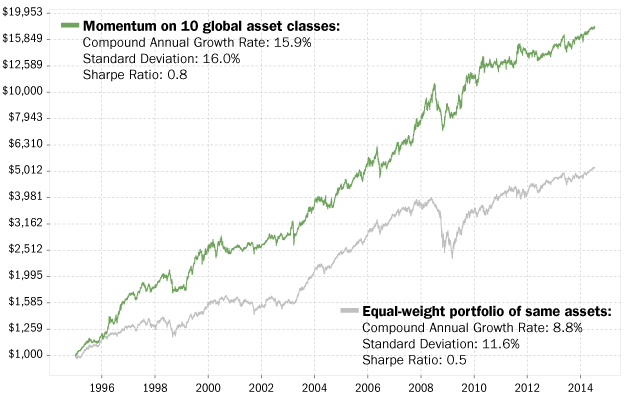
Another approach is to consider the relative momentum (recent returns) of one asset class versus another. To prove the point that, as one prominent researcher puts it, “momentum is everywhere,” let’s look at 10 different asset classes rather than just U.S. stocks. We’ll also include European, Japanese, and emerging market stocks, medium and long-term bonds, U.S. and foreign real estate, commodities, and gold. We’ll use a simple measure of price momentum: calculate the most recent 6 month return in each asset class, and hold the top 33% best performing assets. We perform this calculation every month and adjust the portfolio as necessary. The results show that this global momentum portfolio outperforms an equal-weight portfolio of the same assets by more than 7 percent per year:
Risk-adjusted momentum
In the TSP Folio strategy, we use a more sophisticated momentum algorithm that not only considers the recent TSP fund returns, but also measures their risk, choosing those funds with the best risk-adjusted return. Using a trend-following approach, we also steer clear of TSP funds that are in a downtrend during any given period.
Rather than looking only at one (arbitrary) lookback period such as 6 months, we measure and combine the results from a much broader range — from one month to a year. This helps to avoid “parameter optimization” and makes the strategy more likely to continue working in unknown (future) market conditions.
Volatility
Asset class volatility — for example the magnitude of daily price changes in a TSP fund — is also somewhat predictable and controllable.[3] In mathematical terms, volatility is known to be serially correlated. Volatility clustering refers to the observation, as first noted by Benoît Mandelbrot in 1963,[4] that “large changes tend to be followed by large changes — of either sign — and small changes tend to be followed by small changes.” This led to the development of sophisticated mathematical volatility models like ARCH, GARCH, and others that don’t rhyme and are only slightly easier on the throat to pronounce.
 Fractals! Polish mathematician Benoît Mandelbrot, the “father of fractals,” also discovered volatility clustering in financial time series.
What this means to you and me is that we can measure the recent price volatility in a stock index or TSP fund and use that to estimate its volatility in the near future. You can imagine that in the right hands (hint, hint — our tactical strategy) this can be a useful tool to control the volatility of a portfolio. Take for example an investment in the U.S. stock market, say the TSP C Fund. As the volatility of the C Fund increases, we can gradually reduce our portfolio exposure to it, and allocate the remainder to a low volatility or risk-free choice like the G Fund. By doing this consistently every month, we can “target” an overall desired level of volatility for the portfolio, and keep it within an acceptable range.[5]
The result, at least in backtests and our out-of-sample performance as of this writing, has been a “smooth ride,” much less of a roller coaster than the usual markets. This increases the likelihood that an investor will stick with the strategy in both bull and bear markets.
Trend-following and active risk management
It’s no coincidence that the top priority of many successful investors is not returns, but risk management. As Warren Buffett puts it:
The first rule is not to lose. The second rule is not to forget the first rule.
One effective method to manage portfolio risk is by trend-following: use a systematic method to determine whether the trend in a particular asset class is up or down, and divest from it while it is in a downtrend. This can be accomplished for example by using a Simple Moving Average crossover algorithm. Investment manager Meb Faber (who has popularized this particular approach) points out that the most important benefit of this approach is to control risk and minimize investment losses, not to “beat the market.”
Another approach to limit portfolio risk is by limiting the maximum percentage allocation to volatile assets like stocks. In the TSP Folio strategy, we never allocate more than 60% of the portfolio to the TSP stock funds.
Dynamic, adaptive asset allocation
Combining these and other techniques, we optimize and adjust the TSP Folio model portfolio allocation on a monthly basis. As you can see, the actual percentage invested in any given TSP fund fluctuates as markets and trends change. The table below shows the strategy’s average and maximum historical allocation to each fund, calculated for the period September 1990 to August 2014. The strategy’s average allocation to TSP stock funds during this period was 40.4%, and its maximum stock allocation is always limited (by design) to 60%:
|
TSP Folio Allocation: |
G Fund | F Fund | C Fund | S Fund | I Fund |
Total Stocks |
|---|---|---|---|---|---|---|
| Average | 20.2% | 39.4% | 12.9% | 13.0% | 14.5% | 40.4% |
| Minimum | 0.0% | 0.0% | 0.0% | 0.0% | 0.0% | 0.0% |
| Maximum | 100.0% | 100.0% | 55.0% | 56.0% | 60.0% | 60.0% |
Conclusion
You can think of each of the techniques that we apply in the TSP Folio strategy — momentum investing, trend-following, volatility targeting — as a small “information edge.” By combining these edges, we’ve created a systematic TSP investment strategy that has achieved superior risk-adjusted returns.
Notes
- This is in part because raw momentum is difficult to follow: yes, you get higher returns, but along with that, higher volatility and drawdowns. That’s why some tactical investment strategies (including ours) combine momentum with other techniques like trend-following and volatility targeting, in order to manage and minimize portfolio risk and drawdowns.
- Kenneth R. French Data Library at Dartmouth University
- Mandelbrot, B. B., The Variation of Certain Speculative Prices, The Journal of Business 36, No. 4, (1963), page 394-419.
- In quantitative finance, as in the real world, nothing is perfect. However, perfection is not necessary: even a small edge (e.g., a volatility estimate with better than 50% accuracy), used consistently and systematically can lead to significantly better results than the naîve alternative.
- As a corollary, during periods when the recent volatility of an asset class is low, even if the asset class is traditionally perceived as risky (e.g., stocks), it is actually relatively safe to have a larger exposure to it (assuming that it is also trending up).