Managing risk with a Simple Moving Average (SMA)
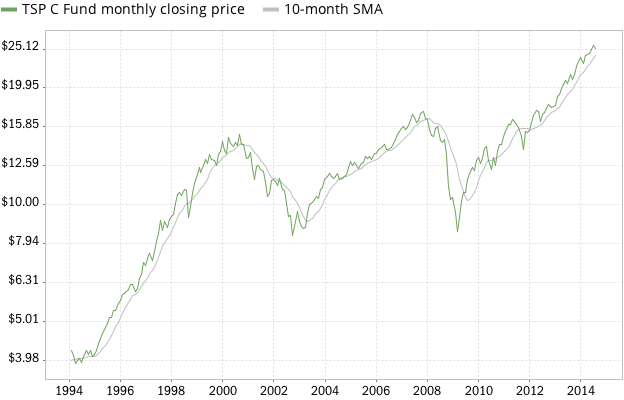
The Simple Moving Average (SMA) is a popular trend-following indicator. When graphed on a chart, it filters out the day-to-day noise in security prices, revealing the longer-term trend. The following chart shows the TSP C Fund along with its 10-month SMA:
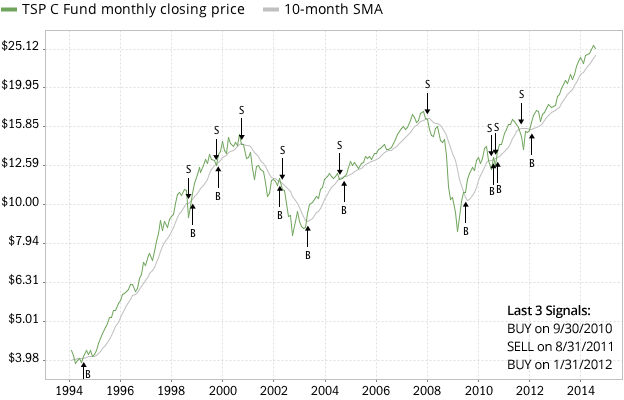
Investors can use the SMA as a signal to time the buying and selling of a security. In an upward trend, the investor buys the security when its monthly closing price crosses above the SMA, rides the trend, and then sells it when the trend direction reverses and the price crosses below the SMA. Below is the same chart as before, with the Buy (B) and Sell (S) trading signals added. You can see that the strategy had its last Buy signal on 1/31/2012:
Now lets use these BUY/SELL signals in a simple trend-following system with the following rules: Buy the TSP C Fund when the monthly closing price rises above its 10-month SMA. Otherwise, sell it and invest the proceeds in the G Fund (a risk-free investment). The result...