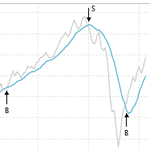
The Simple Moving Average (SMA) is a popular trend-following indicator. When graphed on a chart, it filters out the day-to-day noise in security prices, revealing the longer-term trend. The following chart shows the TSP C Fund along with its 10-month SMA:
Investors can use the SMA as a signal to time the buying and selling of a security. In an upward trend, the investor buys the security when i...